$1.230 billion
in FY25 proposals
$317.1 million
in FY25 awards
1,404 awards
given in FY25
Grant/Contract Metrics
| FY20 | FY21 | FY22 | FY23 | FY24 | FY25 | |
|---|---|---|---|---|---|---|
| Proposal Counts | 2,576 | 2,477 | 2,215 | 2,351 | 2,390 | 2,298 |
| Proposal Amounts | $988,928,650 | $1,232,866,787 | $963,910,525 | $1,156,330,839 | $1,218,225,473 | $1,229,611,244 |
| Award Counts | 1,645 | 1,469 | 1,557 | 1,572 | 1,554 | 1,404 |
| Award Amounts | $242,512,365 | $261,635,138 | $283,620,164 | $309,814,368 | $331,681,317 | $317,073,204 |
| Average Award Amount | $147,424 | $178,104 | $182,158 | $197,083 | $213,437 | $225,836 |
| NSF HERD R&D Expenditures | $335,201,000 | $357,648,000 | $368,396,000 | $378,744,000 | $403,369,000 | Nov’ 26 |
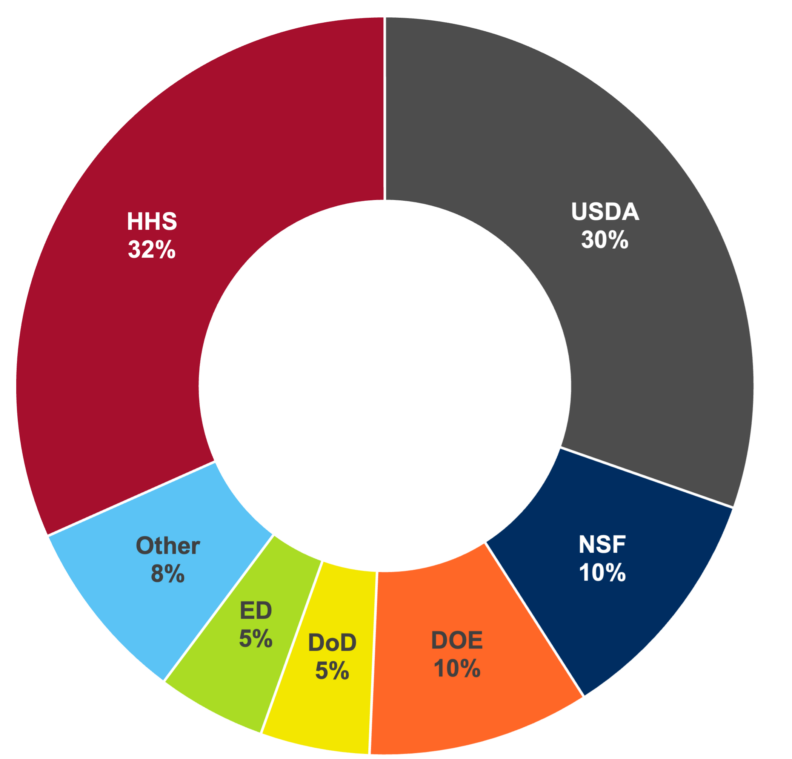
Share of Awards for R&D by Federal Agency, FY19–FY24
R&D only, passthrough included, stimulus excluded
Amount of Awards for R&D by Federal Agency, FY25
R&D only, passthrough included
- USDA: $65,625,050
- HHS: $60,867,777
- DOE: $26,944,592
- NSF: $16,119,003
- DoD: $14,883,395
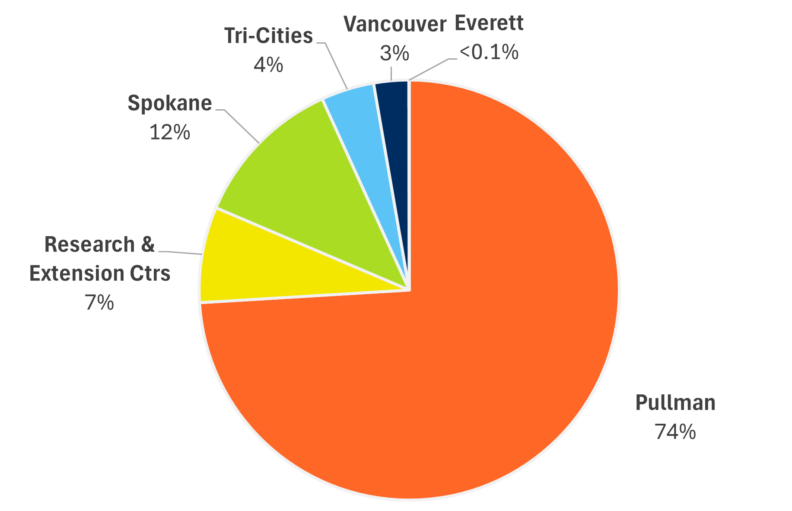
Breakdown of FY 2025 HERD R&D Expenditures by Location
Values are provisional and reflect only expenditures assignable to cost centers.
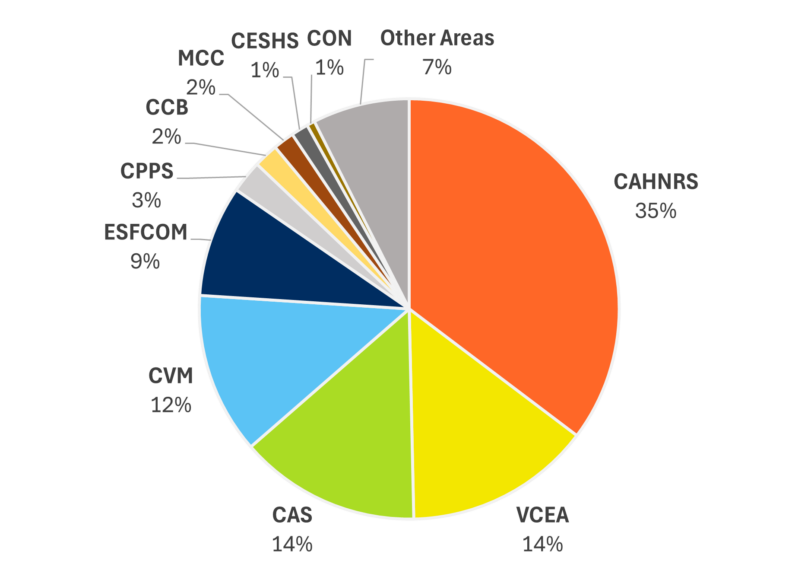
Breakdown of FY 2025 HERD R&D Expenditures by College
Values are provisional and reflect only expenditures assignable to cost
Faculty Counts
| FY20 | FY21 | FY22 | FY23 | FY24 | FY25 | |
|---|---|---|---|---|---|---|
| Unique Contact/Lead PIs Submitting Proposals | 821 | 789 | 756 | 770 | 811 | 784 |
| Unique Contact/Lead PIs Receiving Funding | 575 | 579 | 591 | 584 | 591 | 571 |
| Unique T/TT Contact/Lead PI’s Receiving Funding | 410 | 402 | 414 | 407 | 394 | 378 |
| Tenure/Tenure Track Faculty Count (from IR) | 918 | 930 | 908 | 896 | 904 | 891 |
Commercialization Metrics
| FY21 | FY22 | FY23 | FY24 | FY25 | |
|---|---|---|---|---|---|
| Licensing Revenue | $9,495,519 | $15,162,235 | $11,400,955 | $10,391,862 | $19,430,610 |
Research Assurance Metrics
| CY19 | CY20 | CY21 | CY22 | CY23 | |
|---|---|---|---|---|---|
| IRB Protocols | 1,465 | 1,443 | 1,300 | 1,400 | 1,851 |
| IACUC Protocols | 450 | 457 | 400 | 423 | 434 |
| IBC Protocols | 232 | 212 | 208 | 201 | 204 |
| Haz-Mat Shipments | 798 | 1,227 | 1,045 | 618 | 575 |
| RSC Dosimetry | 385 | 453 | 440 | 467 | 615 |
Notes:
- Proposal and Award information excludes Stimulus funding.
- Latest data available as of last update (7/2025).